BusinessVisualization
Reading Candlestick Charts as a Record of Human Psychology
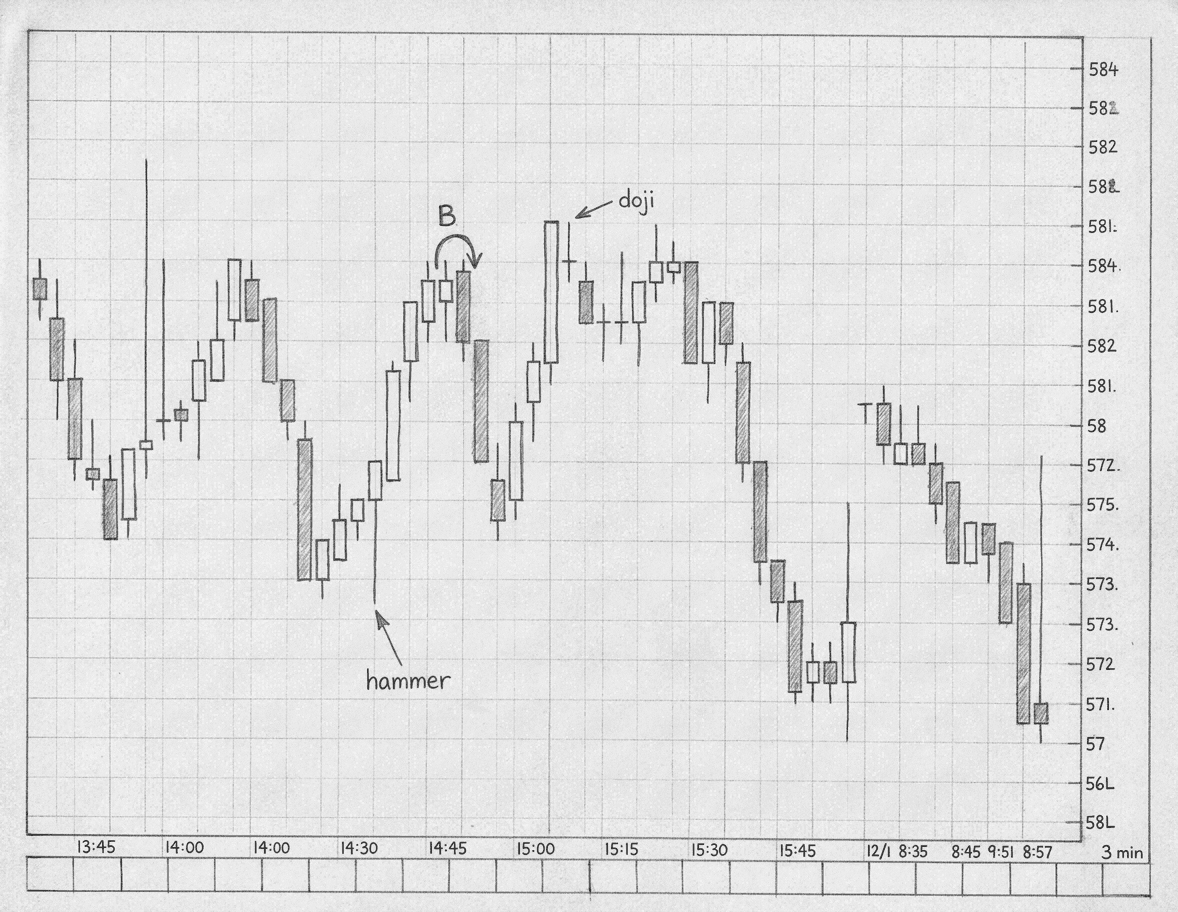
Candlestick charts show what traders felt during a session, not only where the price went. On their own they are not enough. I found they work best when I read them alongside indicators such as Bollinger Bands, ADX and RSI. After reading Steve Nison's book, I see price charts as a visual record of fear, hope and hesitation.
October 3, 2026
9 min read
Candlestick ChartsTechnical AnalysisSteve NisonInvestingData Visualisation
Read more